Plot the MUAPs of a specific matrix channel.
Plot the MUs action potential (MUAPs) shapes with or without average.
| PARAMETER |
DESCRIPTION |
emgfile
|
The dictionary containing the emgfile.
TYPE:
dict
|
stmuap
|
dict containing a dict of ST MUAPs (pd.DataFrame) for every MUs.
TYPE:
dict
|
munumber
|
The number of the MU to plot.
TYPE:
int
|
column
|
The matrix columns.
Options are usyally "col0", "col1", "col2", ..., last column.
TYPE:
str
|
channel
|
The channel of the matrix to plot.
This can be the real channel number if channelprog=False (default),
or a progressive number (from 0 to the length of the matrix column)
if channelprog=True.
TYPE:
int
|
channelprog
|
Whether to use the real channel number or a progressive number
(see channel).
TYPE:
bool
DEFAULT:
False
|
average
|
Whether to plot also the MUAPs average obtained by spike triggered
average.
TYPE:
bool
DEFAULT:
True
|
timeinseconds
|
Whether to show the time on the x-axes in seconds (True)
or in samples (False).
TYPE:
bool
DEFAULT:
True
|
figsize
|
Size of the figure in centimeters [width, height].
TYPE:
list
DEFAULT:
[20, 15]
|
tight_layout
|
If True (default), fig.tight_layout() is called and the figure's
layout is improved.
It is useful to set it to False when calling the function from a GUI.
TYPE:
bool
DEFAULT:
True
|
line2d_kwargs_ax1
|
Kwargs for matplotlib.lines.Line2D relative to figure's axis 1 (the
single MUAPs).
TYPE:
dict
DEFAULT:
None
|
line2d_kwargs_ax2
|
Kwargs for matplotlib.lines.Line2D relative to figure's axis 2 (the
average MUAP).
TYPE:
dict
DEFAULT:
None
|
axes_kwargs
|
Kwargs for figure's axes.
TYPE:
dict
DEFAULT:
None
|
showimmediately
|
If True (default), plt.show() is called to display the figure to the
user. This has an effect only if use_plt is True. Set to False when
using the function within a GUI or when managing figure display
manually.
TYPE:
bool
DEFAULT:
True
|
use_plt
|
Whether to use the pyplot interface (plt.subplots) or the
object-oriented matplotlib.figure.Figure API to create the figure.
Set to False in GUI applications or headless environments to avoid the
persistent pyplot's global state.
TYPE:
bool
DEFAULT:
True
|
| RETURNS |
DESCRIPTION |
fig
|
TYPE:
pyplot `~.figure.Figure`
|
See also
- plot_muaps : Plot MUAPs obtained from STA from one or multiple MUs.
- st_muap : Generate spike triggered MUAPs of every MUs
(as input to this function).
Examples:
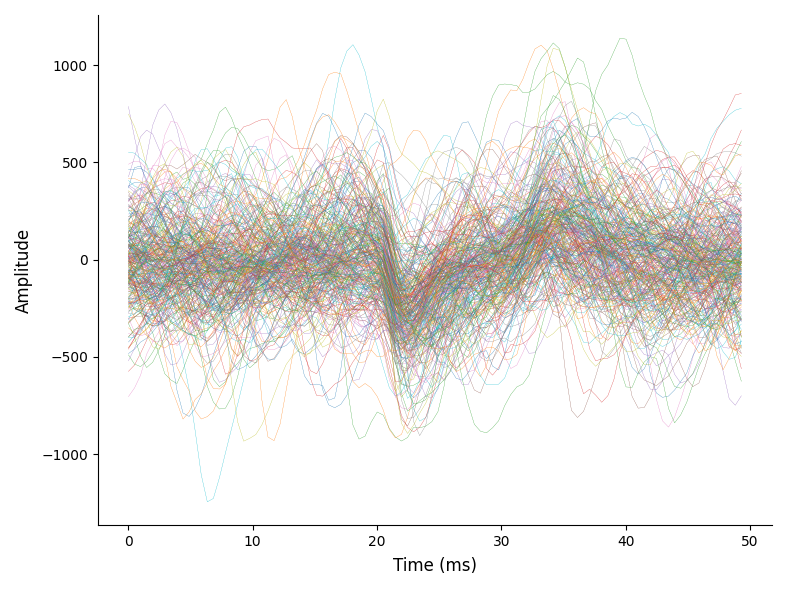
Plot all the consecutive MUAPs of a single MU.
In this case we are plotting the matrix channel 35 which is placed in
column 3 ("col2" as Python numbering is base 0).
>>> import openhdemg.library as emg
>>> emgfile = emg.emg_from_samplefile()
>>> sorted_rawemg = emg.sort_rawemg(
...     emgfile,
...     code="GR08MM1305",
...     orientation=180,
...     dividebycolumn=True,
... )
>>> stmuap = emg.st_muap(
...     emgfile=emgfile,
...     sorted_rawemg=sorted_rawemg,
...     timewindow=50,
... )
>>> emg.plot_muap(
...     emgfile=emgfile,
...     stmuap=stmuap,
...     munumber=3,
...     column="col2",
...     channel=35,
...     channelprog=False,
...     average=False,
...     timeinseconds=True,
...     figsize=[20, 15],
...     showimmediately=True,
... )
To avoid the problem of remebering which channel number is present in
which matrix column, we can set channelprog=True and locate the channel
with a value ranging from 0 to the length of each column.
>>> emg.plot_muap(
...     emgfile=emgfile,
...     stmuap=stmuap,
...     munumber=3,
...     column="col2",
...     channel=9,
...     channelprog=True,
...     average=False,
...     timeinseconds=True,
...     figsize=[20, 15],
...     showimmediately=True,
... )
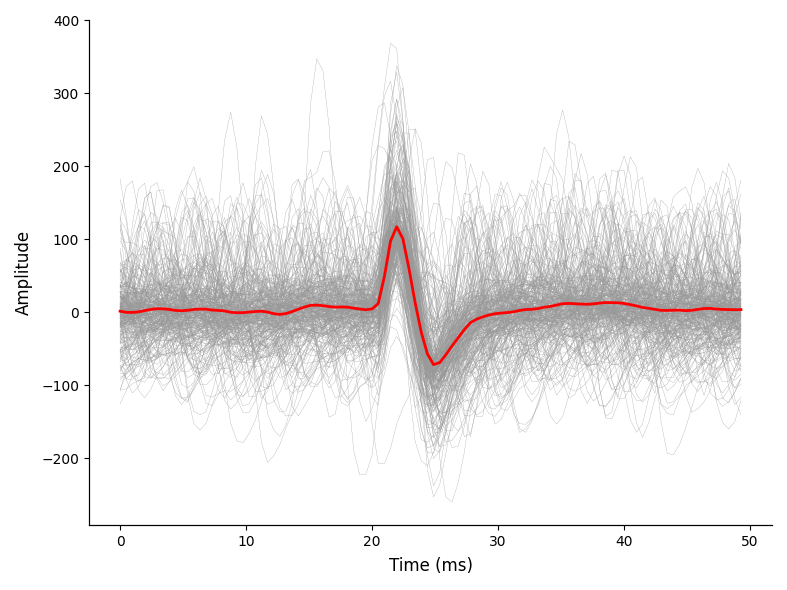
It is also possible to visualise the spike triggered average
of the MU with average=True.
In this example the single differential derivation is used.
>>> import openhdemg.library as emg
>>> emgfile = emg.emg_from_samplefile()
>>> sorted_rawemg = emg.sort_rawemg(
...     emgfile=emgfile,
...     code="GR08MM1305",
...     orientation=180,
...     dividebycolumn=True,
... )
>>> sorted_rawemg = emg.diff(sorted_rawemg=sorted_rawemg)
>>> stmuap = emg.st_muap(
...     emgfile=emgfile,
...     sorted_rawemg=sorted_rawemg,
...     timewindow=50,
... )
>>> emg.plot_muap(
...     emgfile=emgfile,
...     stmuap=stmuap,
...     munumber=3,
...     column="col2",
...     channel=8,
...     channelprog=True,
...     average=True,
...     timeinseconds=True,
...     figsize=[20, 15],
...     showimmediately=True,
... )
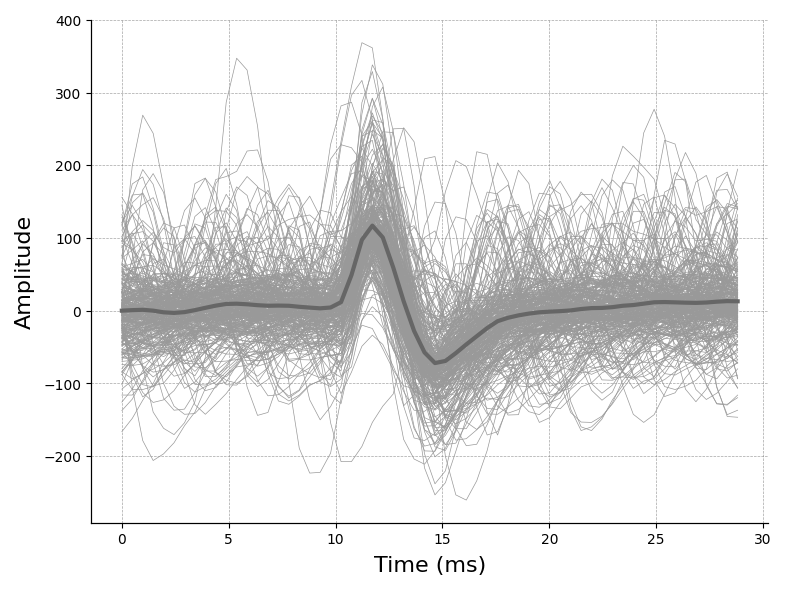
We can also customise the look of the plot.
>>> import openhdemg.library as emg
>>> emgfile = emg.emg_from_samplefile()
>>> sorted_rawemg = emg.sort_rawemg(
...     emgfile=emgfile,
...     code="GR08MM1305",
...     orientation=180,
...     dividebycolumn=True,
... )
>>> sorted_rawemg = emg.diff(sorted_rawemg=sorted_rawemg)
>>> stmuap = emg.st_muap(
...     emgfile=emgfile,
...     sorted_rawemg=sorted_rawemg,
...     timewindow=30,
... )
>>> line2d_kwargs_ax1 = {"linewidth": 0.5}
>>> line2d_kwargs_ax2 = {"linewidth": 3, "color": '0.4'}
>>> axes_kwargs = {
...     "grid": {
...         "visible": True,
...         "axis": "both",
...         "color": "gray",
...         "linestyle": "--",
...         "linewidth": 0.5,
...         "alpha": 0.7
...     },
...     "labels": {
...         "xlabel_size": 16,
...         "ylabel_sx_size": 16,
...     },
... }
>>> fig = emg.plot_muap(
...     emgfile=emgfile,
...     stmuap=stmuap,
...     munumber=3,
...     column="col2",
...     channel=35,
...     channelprog=False,
...     average=True,
...     timeinseconds=True,
...     figsize=[20, 15],
...     line2d_kwargs_ax1=line2d_kwargs_ax1,
...     line2d_kwargs_ax2=line2d_kwargs_ax2,
...     axes_kwargs=axes_kwargs,
...     showimmediately=True,
... )
For further examples on how to customise the figure's layout, refer to
plot_emgsig().