Graphical Interface
Welcome, to the openhdemg Graphical User Interface (GUI) introduction!
The openhdemg GUI incorporates all relevant high-level functions of the openhdemg library. The GUI allows you to successfully perform High-Density Electromyography (HD-EMG) data anlysis without any programming skills required. Moreover, there is no downside to using the GUI even if you are an experienced programmer.
The GUI can be simply accessed from the command line with:
python -m openhdemg.gui.openhdemg_gui
Let us shortly walk you through the main window of the GUI. An image of the starting page of the GUI is displayed below.
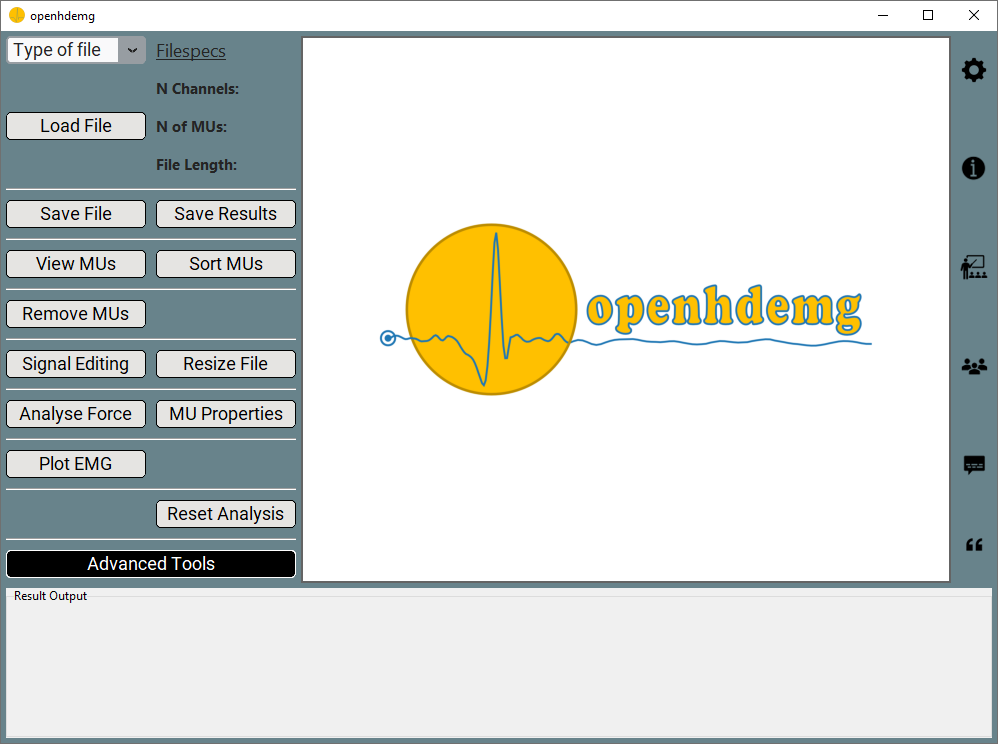
This is your starting point for every analysis. On the left hand side you can find all the entryboxes and buttons relevant for the analyses you want to perform. In the middle you can see the plotting canvas where plots of the HD-EMG data analysis are displayed. On the right hand side you can find information buttons leading you directly to more information, tutorials, and more. Very important, at the top of this section, there is the settings icon (Gear icon). By clicking this icon, you will be able to change some of the GUI settings. Finally, at the bottom of the GUI there is a window used to display the results of the analyses.
Specifying an analysis file
-
In order to load file into the GUI, you first need to select something in the Type of file dropdown box at the top left corner. The available filetypes are:
OPENHDEMG (emgfile or reference signal stored in .json format)DEMUSE (.mat file used in DEMUSE)OTB (.mat file exportable by OTBiolab+)OTB_REFSIG (Reference signal in the .mat file exportable by OTBiolab+)DELSYS (.mat and .txt files exportable by Delsys software)DELSYS_REFSIG (.mat file exportable by Delsys software)CUSTOMCSV (custom data from a .csv file)CUSTOMCSV_REFSIG (Reference signal in a custom .csv file)
Each filetype corresponds to a distinct datatype that should match the file you want to analyse. So, select the Type of file corresponding to the type of your file.
-
Before loading a file, verify that the GUI settings are correct for your needs.
-
To actually load the file, click the Load File button and select the file you want to analyse. In case of occurence, follow the error messages and repeat this and the previos step.
-
Once the file is successfully loaded, the specifications of the file you want to analyse will be displayed next to the Load File button.
Viewing an analysis file
It doesn't get any simpler than this!
Once a file is successfully loaded as described above, a plot containing your data should appear in the middle section of the GUI, allowing you to
view the content of your file. This can also be force by clicking the View MUs button.
In the two sections above, we described the two most rudimental functions in the GUI. To learn more about basic and more advanced analysis features of the GUI, check out the basic and advanced chapters.
More questions?
We hope that this tutorial was useful. If you need any additional information, do not hesitate to read the answers or ask a question in the openhdemg discussion section. If you are not familiar with GitHub discussions, please read this post. This will allow the openhdemg community to answer your questions.