Plot the PCA component-selection criterion.
| PARAMETER |
DESCRIPTION |
pca_results
|
Dictionary containing the PCA results from smoothed_dr_pca.
TYPE:
dict
|
components_to_plot
|
Number of components to plot. If -1, all components are plotted.
TYPE:
int
DEFAULT:
-1
|
component_numbering_base
|
Base used to number components on the x-axis. If 0, components are
numbered from 0. If 1, components are numbered from 1.
TYPE:
int
DEFAULT:
0
|
show_legend
|
If True, the legend describing the plotted component-selection
quantities is shown.
TYPE:
bool
DEFAULT:
True
|
legend_location
|
Location of the legend.
inside
The legend is placed inside the figure.
outside
The legend is placed outside the figure.
TYPE:
str {"inside", "outside"}
DEFAULT:
"inside"
|
figsize
|
Size of the figure in centimeters [width, height].
TYPE:
list
DEFAULT:
[20, 15]
|
tight_layout
|
If True (default), fig.tight_layout() is called and the figure's
layout is improved.
It is useful to set it to False when calling the function from a GUI.
TYPE:
bool
DEFAULT:
True
|
showimmediately
|
If True (default), plt.show() is called to display the figure to the
user. This has an effect only if use_plt is True. Set to False when
using the function within a GUI or when managing figure display
manually.
TYPE:
bool
DEFAULT:
True
|
use_plt
|
Whether to use the pyplot interface (plt.subplots) or the
object-oriented matplotlib.figure.Figure API to create the figure.
Set to False in GUI applications or headless environments to avoid the
persistent pyplot's global state.
TYPE:
bool
DEFAULT:
True
|
| RETURNS |
DESCRIPTION |
fig
|
The generated PCA component-selection figure.
TYPE:
pyplot `~.figure.Figure`
|
Examples:
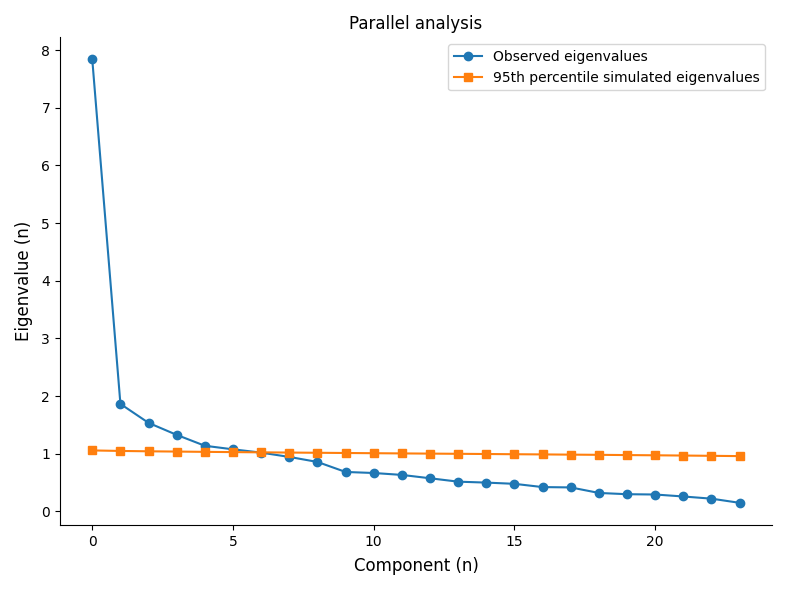
Plot the number of PCA components retained using parallel analysis.
>>> import openhdemg.library as emg
>>> emgfile = emg.askloadmodule()
>>> steady_emgfile, _, _ = emg.resize_emgfile(
...     emgfile,
...     area=[15400, 50770],
... )
>>> pca_results = emg.smoothed_dr_pca(
...     emgfile=steady_emgfile,
...     method_n_components="parallel_analysis",
... )
>>> emg.plot_smoothed_dr_pca_selection(pca_results=pca_results)
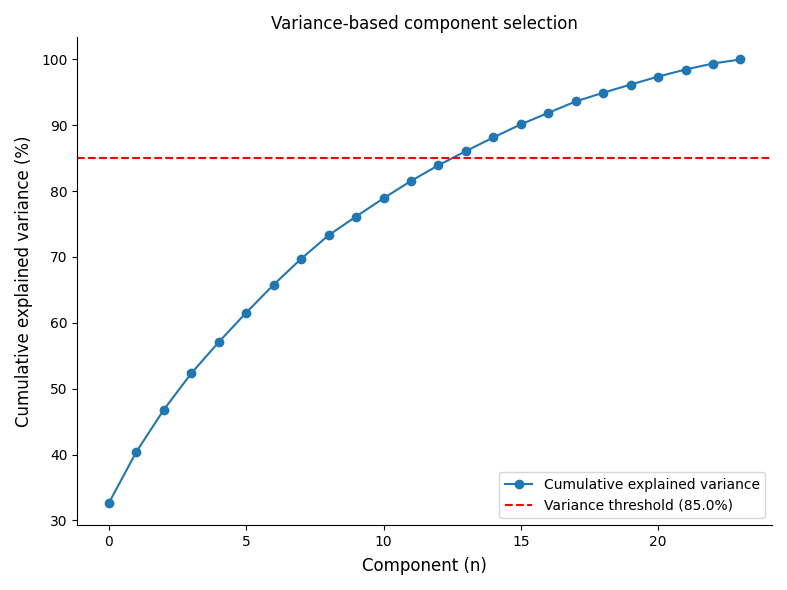
Plot the number of PCA components retained using a cumulative explained
variance threshold.
>>> import openhdemg.library as emg
>>> emgfile = emg.askloadmodule()
>>> steady_emgfile, _, _ = emg.resize_emgfile(
...     emgfile,
...     area=[15400, 50770],
... )
>>> pca_results = emg.smoothed_dr_pca(
...     emgfile=steady_emgfile,
...     method_n_components="variance_greater_than_threshold",
...     variance_threshold=85.0,
... )
>>> emg.plot_smoothed_dr_pca_selection(pca_results=pca_results)
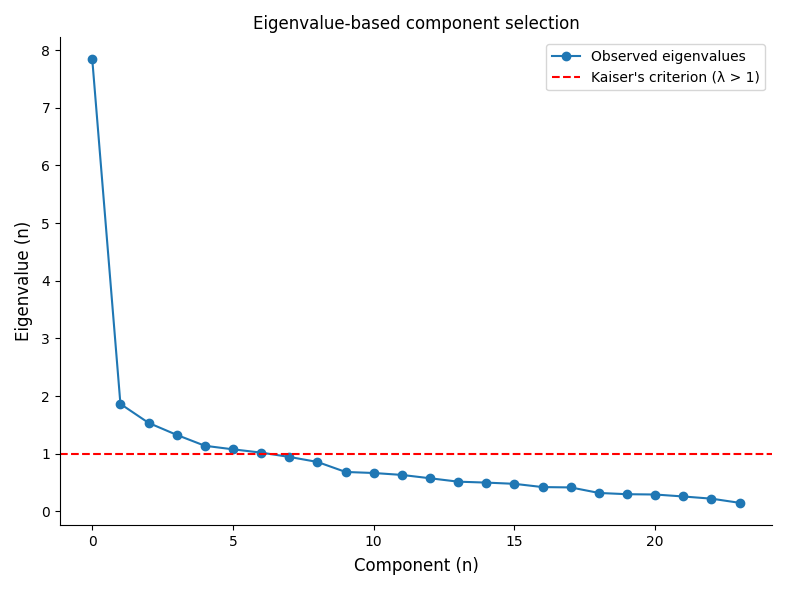
Plot the number of PCA components retained using Kaiser's criterion.
>>> import openhdemg.library as emg
>>> emgfile = emg.askloadmodule()
>>> steady_emgfile, _, _ = emg.resize_emgfile(
...     emgfile,
...     area=[15400, 50770],
... )
>>> pca_results = emg.smoothed_dr_pca(
...     emgfile=steady_emgfile,
...     method_n_components="eigenvalue_greater_than_one",
... )
>>> emg.plot_smoothed_dr_pca_selection(pca_results=pca_results)